|
Getting your Trinity Audio player ready...
|
Unlock the potential of A/B testing in data science for evidence-based decisions. Compare variations, measure impact, and refine strategies. This powerful tool empowers businesses to analyze user behavior, optimize product features, and elevate performance, ensuring informed choices in a competitive landscape.
A/B Testing for Data Science
A/B testing is a cornerstone for making informed decisions and optimizing outcomes. It is also known as split testing; A/B testing involves comparing two versions—A and B—of a variable to discern which performs better.
This method allows organizations to make informed choices based on real-world data rather than assumptions. By systematically testing variations and measuring their impact on user behavior or outcomes, businesses can refine strategies, enhance user experiences, and ultimately boost performance.
This comprehensive guide is tailored for Data Scientists and offers insights into the intricacies of A/B testing using Python. Let’s dive into the must-know aspects of A/B testing, empowering you to harness its potential for data-driven success.
Key takeaways
- A/B testing compares two versions to measure performance.
- It informs data-driven decisions in digital analytics and marketing.
- Implementation involves setting objectives, split-testing, and data analysis.
- Statistical significance determines the reliability of results.
- A/B testing is versatile and applicable to websites, apps, and various business strategies.
Understanding A/B Testing
A/B testing, also known as split testing, is a statistical method used to compare two versions of a variable to determine which performs better. In the context of Data Science, this often involves comparing user engagement, conversion rates, or other key metrics between two groups – a control group and a treatment group.
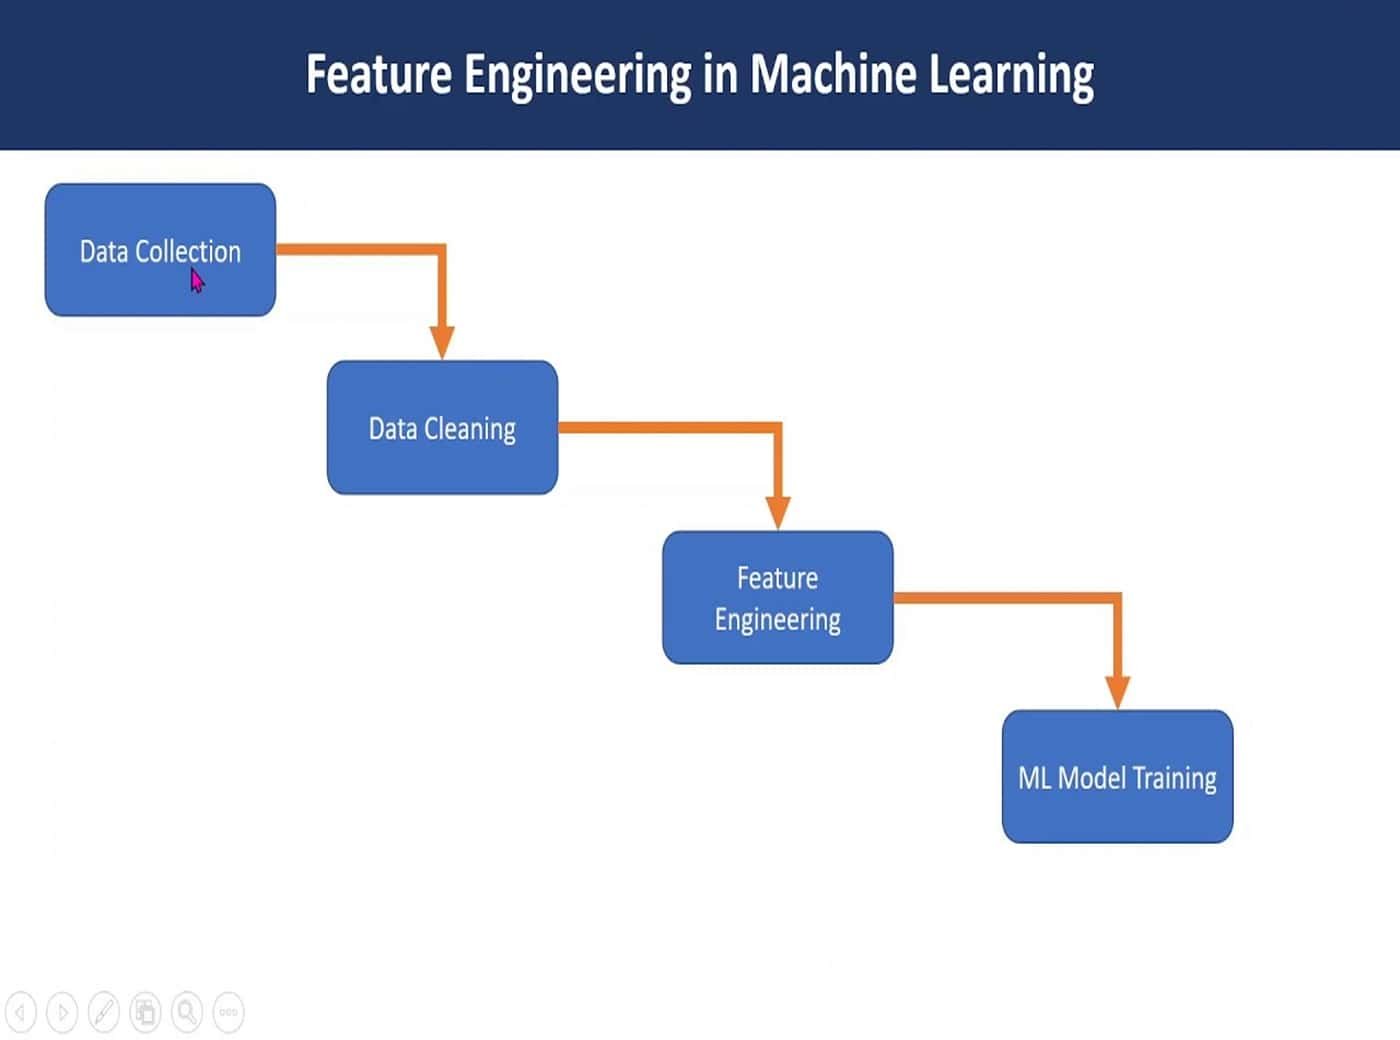
Setting Up Your Experiment in Python
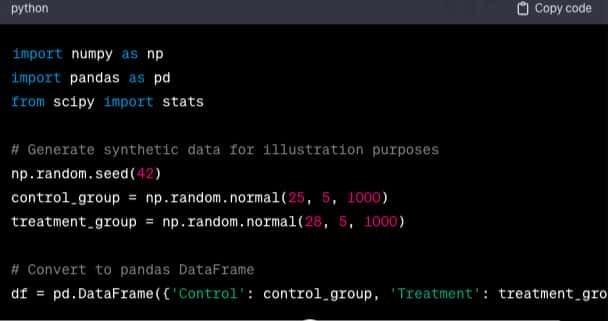
Python, with its rich ecosystem of libraries, is a powerful tool for conducting A/B tests. The first step is to set up your experiment using libraries such as NumPy, pandas, and SciPy. Create datasets for both the control and treatment groups, ensuring they are representative and randomly assigned.
Hypothesis Formulation
A crucial aspect of A/B testing is formulating clear hypotheses. The null hypothesis typically posits that there is no significant difference between the control and treatment groups, while the alternative hypothesis asserts the presence of a statistically significant difference.
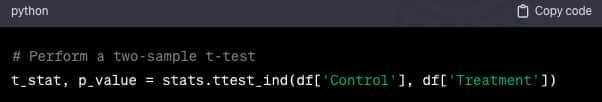
Statistical Significance and Confidence Intervals
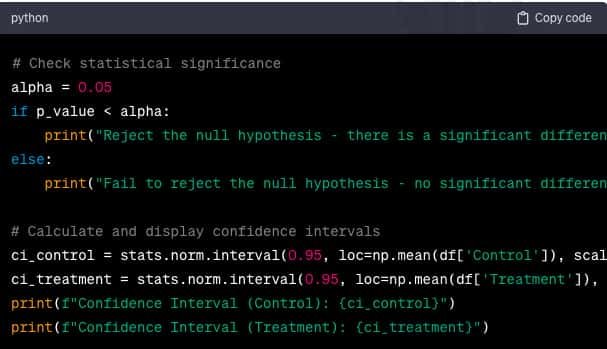
Determining statistical significance is pivotal in A/B testing. Python’s statistical libraries provide functions to calculate p-values, allowing you to ascertain whether the observed differences are statistically significant. Additionally, constructing confidence intervals provides a range within which you can be confident the true effect lies.
Practical Considerations and Best Practices
A successful A/B test goes beyond statistical calculations. Consider factors like the test duration, potential biases, and ethical considerations. Implementing best practices, such as randomization, helps ensure the reliability of your results.
Visualizing Results
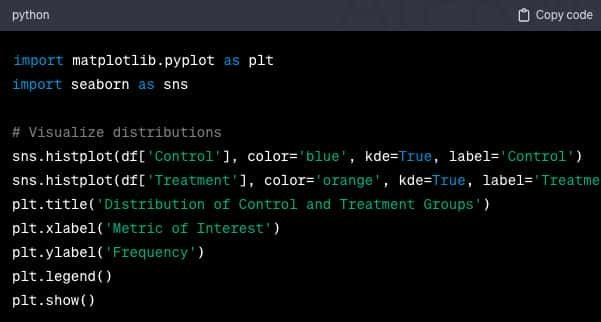
Python’s data visualization libraries, such as Matplotlib and Seaborn, play a vital role in conveying A/B test results effectively. Generate clear and insightful visualizations to communicate findings with stakeholders.
A/B testing statistics example
Consider an e-commerce website aiming to optimize its checkout process. The team decides to conduct an A/B test by introducing a new payment button (B) on the checkout page while keeping the original button (A) for the control group. The metric of interest is the conversion rate—the percentage of users completing a purchase.
After a predefined period, the data is collected:
- Control Group (A): 5000 users, 250 conversions (5% conversion rate)
- Treatment Group (B): 5200 users, 300 conversions (5.77% conversion rate)
To analyze statistical significance, a two-sample t-test is conducted, resulting in a p-value of 0.03. With a significance level (alpha) set at 0.05, the p-value indicates a statistically significant difference. Therefore, the team concluded that the new payment button (B) has a positive impact on the conversion rate, and they decided to implement it site-wide for improved user engagement and revenue.
A/B testing Data Science project

To understand the application of A/B testing in Data Science, let’s take this example: imagine a mobile app developer seeking to optimize user engagement. The team decides to test a new feature (B) against the existing one (A). They randomly assign users into two groups, collecting data on metrics like user interactions and retention over a month.
Upon analysis, they observe a 15% increase in user engagement for the treatment group (B). Statistical tests, such as a two-sample t-test, yield a p-value below 0.05, indicating significance. This prompts the team to confidently implement the new feature, showcasing the power of data-driven decision-making in enhancing product performance.
Frequently asked questions
What is an A/B test in Data Science?
A/B testing in Data Science is a method to compare two versions (A and B) of a variable, measuring their performance to make informed decisions. It assesses the impact of changes, providing valuable insights into user behavior, product features, or marketing strategies.
How to perform A/B testing in data analytics step by step?
To perform A/B testing in data analytics, set clear objectives, split users into control and treatment groups, implement changes in one group (B), collect and analyze data, and determine statistical significance. Tools like Python and R assist in executing and interpreting the tests.
How would you explain A/B testing to someone who isn’t familiar with statistics?
A/B testing is like a scientific experiment for business decisions. Imagine comparing two recipes (A and B) to see which one people prefer. It helps us make choices based on real-world data, not just assumptions, making decisions more reliable and effective.
What is an example of A/B testing?
An example of A/B testing is testing two versions of a website’s landing page. The control group sees the original design (A), while the treatment group sees a modified version (B). By analyzing user behavior and conversions, businesses can determine which design performs better and optimize accordingly.
Wrapping it up !!!
Mastering A/B testing using Python is a fundamental skill for Data Scientists. This guide provides a roadmap for setting up experiments, formulating hypotheses, assessing statistical significance, and implementing best practices.
With Python’s robust tools and libraries, Data Scientists can unlock the full potential of A/B testing, making informed decisions that drive data-driven success.
If you too want to learn in-depth about A/B testing in Data Science, you can enroll for the Data Science course with Pickl.AI. As a part of its curriculum, you can learn about the different concepts of Data Science along with the tools that will help you become a proficient Data Scientist.
Author
-

Written by:
Nitin Choudhary