Introduction:
We live in a data-driven world, and data analytics plays a critical role in analysing consumer behaviour and optimizing business strategies. Companies are reaping the benefits by assessing the consumer’s interest in particular products. Tools like Market Basket Analysis in Python are playing a pivotal role in this.
Unfolding the insights and understanding the factors that motivate the customer to purchase becomes easier. It eventually helps improve cross-selling, product placement, and targeted marketing campaigns.
Market Basket Analysis in Python involves data mining technique that helps retailers increase sales by unfolding the details of customer purchasing patterns.
Market Basket Analysis involves working on large data sets. It includes the buying history, revealing product groupings, and products are purchased together. Hence, this tool becomes quite significant for retailers. This article will explore how to perform Market Basket Analysis in Python.
What is Market Basket Analysis in Python?
Market Basket Analysis, also known as Association Analysis or Affinity Analysis, is a data mining technique that unfurls the relationship between products based on the purchase pattern of the consumer.
Python provides various libraries and tools to perform Market Basket Analysis efficiently. One such commonly used library is the mlxtend library. It offers a range of functionalities for performing association rule mining, including the Apriori algorithm (discussed later), a popular algorithm for Market Basket Analysis.
By analyzing customer transaction data, MBA or Market Basket Analysis allows businesses to uncover patterns, associations, and dependencies that are not immediately apparent. This knowledge can be leveraged to optimize business strategies, improve customer experience, and drive revenue growth. The next segment of this blog takes you through some of the key aspects of Market Basket Analysis, along with examples.
How to do Market Basket Analysis in Python?
As we have mentioned, several Python libraries are used for MBA. Apriori Algorithm is one of the most commonly used Python libraries for association data mining.
What is Association Rule Mining?
Apriori Algorithm is used for association rule mining, which unfolds the pattern of items purchased together and concurrence in the same.
For example, one can find a correlation and association between different items that customers purchase and the recurring pattern.
Let’s say Raghav buys a bottle of cold drinks, and along with it, he also adds chips and wafers to his basket. The store manager analyses that, similar to Raghav, many other customers also buy cold drinks, chips and wafers. So, the manager starts placing these products together, eventually boosting sales.
This process of analysing the association between different purchased products is called association rule mining. To implement association rule mining, the Apriori algorithm is used. It is one of the most popular and efficient algorithms.
How Does Apriori Algorithm Work?
The Apriori algorithm is popular in Market Basket Analysis and association rule mining. Its main purpose is to identify frequent itemsets within a transactional dataset. Here’s an explanation of how the Apriori algorithm works:
- Support: The algorithm begins by scanning the dataset to calculate the support of each item. Support refers to the frequency of an item occurring in the dataset and is expressed as a percentage or decimal value.
- Generating Candidate Itemsets: The algorithm generates candidate item sets based on the support values. Initially, it creates a list of frequent 1-item sets, individual items that meet the minimum support threshold. These frequent 1-itemsets are considered as the seeds for generating larger itemsets.
- Joining Step: In this step, the algorithm joins the frequent (k-1)-itemsets to generate candidate k-itemsets. It combines itemsets that share the first (k-2) items. For example, if we have frequent 2-itemsets {A, B} and {A, C}, the algorithm joins them to create a candidate 3-itemset {A, B, C}.
- Pruning Step: The pruning step eliminates candidate itemsets that contain infrequent subsets. If any (k-1)-subset of a candidate k-itemset is infrequent, the candidate k-itemset is pruned since it cannot be a frequent itemset.
- Scanning the Dataset: After generating candidate item sets, the algorithm scans the dataset again to calculate the support of each candidate item set.
- Repeat: Steps 3 to 5 are repeated iteratively until no more frequent itemsets can be generated. The algorithm continues until it reaches a stage where no new frequent itemsets can be found.
- Association Rule Generation: Once all frequent item sets are discovered, association rules are generated. These rules consist of an antecedent (left-hand side) and a consequent (right-hand side). The antecedent represents the items that imply the presence of the consequent in a transaction.
- Rule Evaluation: Finally, the generated association rules are evaluated based on different metrics such as support, confidence, and lift. Support measures the frequency of the rule, confidence indicates the likelihood of the consequent item being purchased given the antecedent, and lift measures the strength of the association between the antecedent and the consequent.
Steps of Market Basket Analysis in Python
- Preparing the Dataset
Before diving into the implementation, gathering and preparing the dataset for Market Basket Analysis is crucial. The dataset should consist of transactional records, where each transaction represents a unique purchase by a customer. Each transaction should contain a list of items purchased.
First, we must import the necessary Python libraries, such as Pandas and NumPy, for data manipulation and analysis. We can then load the dataset into a Pandas DataFrame and explore its structure using various functions and methods provided by the library.
pythonCopy code
import pandas as pd import numpy as np # Load the dataset df = pd.read_csv(‘transaction_data.csv’) # Explore the dataset print(df.head()) print(df.info())
- Data Preprocessing and Exploration
Once the dataset is loaded, it is essential to preprocess and explore the data to ensure its quality and understand its characteristics. This step involves handling missing values, removing duplicates, and transforming the data into the appropriate format for analysis.
- Handling Missing Values
Missing values can hinder the accuracy and reliability of the analysis. Therefore, it is crucial to handle them appropriately. Depending on the dataset, you can choose to remove rows or fill in missing values with appropriate techniques, such as mean imputation or forward/backward filling.
- Removing Duplicates
Duplicate records can skew the analysis results, leading to inaccurate associations. Removing duplicates ensures that each transaction is considered only once during the analysis, providing more reliable insights.
- Data Transformation
Most MBA algorithms require the data to be in a binary format, where each column represents a unique item, and the values indicate whether an item is present in a particular transaction. We can use one-hot or binary encoding techniques to transform the dataset into this format.
- Applying Apriori Algorithm
Apriori algorithm is a popular and widely used algorithm for Market Basket Analysis. It helps identify frequent itemsets and generate association rules based on those itemsets. The algorithm follows the “Apriori property” principle, which states that any subset of a frequent itemset must also be frequent.
To implement the Apriori algorithm in Python, we can utilize the mlxtend library, which provides efficient implementations of various association rule mining algorithms.
- Installing mlxtend
Before proceeding, we need to install the mlxtend library using pip:
pythonCopy code
!pip install mlxtend
- Applying Apriori
Once the library is installed, we can import the necessary functions and apply the Apriori algorithm to our preprocessed dataset.
from mlxtend.frequent_patterns import apriori from mlxtend.frequent_patterns import association_rules # Applying Apriori algorithm frequent_itemsets = apriori(df, min_support=0.1, use_colnames=True) # Generating association rules rules = association_rules(frequent_itemsets, metric=”lift”, min_threshold=1)
- Analyzing the Results
After applying the Apriori algorithm, we obtain a set of frequent item sets and corresponding association rules. These rules provide valuable insights into product relationships and can be used to optimize business strategies.
- Interpreting Association Rules
Association rules consist of an antecedent (left-hand side), a consequent (right-hand side), and various metrics such as support, confidence, and lift. Here’s an example of how an association rule can be interpreted:
{Product A} => {Product B} [support=s, confidence=c, lift=l]
- Support: Indicates the frequency of occurrence of both products in transactions.
- Confidence: Represents the conditional probability of purchasing Product B given that Product A is already purchased.
- Lift: Measures the strength of the association between the antecedent and consequent. A lift greater than 1 indicates a positive association.
- Filtering and Sorting Rules
Depending on your business goals, you can filter the generated association rules based on specific metrics. For example, you may focus on rules with high support and confidence values to identify strong associations. Additionally, sorting the rules based on the lift can reveal the most influential associations.
- Visualizing the Results
Data visualization plays a crucial role in conveying insights effectively. By visualizing the association rules, we can better understand the relationships between products and identify patterns that might not be immediately apparent in tabular form.
Python offers various libraries for data visualization, such as Matplotlib and Seaborn. These libraries enable us to create bar plots, scatter plots, and network graphs to visualize the association rules and their corresponding metrics.
Market Basket Analysis Example:
To understand the above-mentioned steps, let’s consider an example:
ABC retail store sells groceries. It collects transactional data that includes information about customer purchases. Each transaction consists of a unique identifier (e.g., receipt number) and a list of items bought together.
With Market Basket Analysis, the store aims to understand the association and pattern between different customer products. Based on this data, they will be optimizing their business strategy.
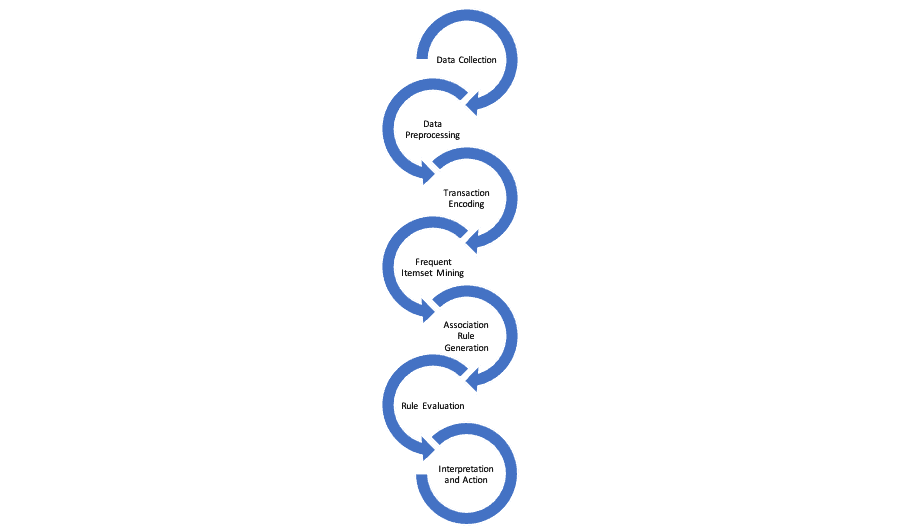
Step 1: Data Collection
The store gathers transactional data over a period of time. For example, they have a dataset containing information about individual transactions, such as:
Transaction 1: Milk, Bread, Eggs, Cheese
Transaction 2: Bread, Butter, Eggs
Transaction 3: Milk, Bread, Butter, Yogurt
Transaction 4: Bread, Eggs, Cheese, Yogurt
Step 2: Data Preprocessing
Cleansing of data to ensure precise outcomes. Removal of duplicity or irrelevant information.
Step 3: Transaction Encoding
The transaction data is encoded into a suitable format for analysis. One common approach is binary encoding, where each item is represented as a binary variable (0 or 1) indicating its presence or absence in a transaction.
Transaction 1: 1, 1, 1, 1
Transaction 2: 1, 0, 1, 0
Transaction 3: 1, 1, 0, 1
Transaction 4: 1, 0, 1, 1
Step 4: Frequent Itemset Mining
The store identifies frequent item sets based on a specified support threshold using the Apriori algorithm. Let’s assume a support threshold of 50% for this example.
Frequent 1-itemsets:
Bread: 4
Eggs: 3
Milk: 2
Butter: 2
Cheese: 2
Yoghurt: 2
Step 5: Association Rule Generation
From the frequent itemsets, the store generates association rules. These rules consist of an antecedent (left-hand side) and a consequent (right-hand side). For example:
If customers buy Bread and Eggs, they will also buy Milk. (Bread, Eggs) -> (Milk)
If customers buy Butter and Yogurt, they are likely to buy Bread. (Butter, Yogurt) -> (Bread)
Step 6: Rule Evaluation
The generated rules are evaluated based on support, confidence, and lift metrics. These metrics provide insights into the strength and significance of the associations.
For example, the rule (Bread, Eggs) -> (Milk) may have a support of 25%, confidence of 66% (indicating that 66% of transactions containing Bread and Eggs also contain Milk), and a lift value greater than 1, indicating a positive association.
Step 7: Interpretation and Action
The store analyzes the generated rules to gain insights and take appropriate actions. They may strategically place Milk near the Bread and Eggs sections to encourage additional purchases. They might also create promotions or discounts targeting customers who purchase Butter and Yogurt together to increase Bread sales.
By utilizing market basket analysis, the retail store can optimize product placement, create targeted marketing campaigns, and enhance customer satisfaction, increasing sales and profitability.
Benefits of Market Basket Analysis:
Market Basket Analysis offers several benefits for businesses. Here are some key advantages of utilizing Market Basket Analysis:
- Identifying Product Associations
It helps businesses uncover relationships and associations among products frequently purchased together. By identifying these patterns, businesses can optimize product placement and cross-selling strategies. For example, if customers often buy cereal and milk together, supermarkets can position these items near each other to encourage additional purchases.
- Personalized Recommendations
Today consumers are too picky when it comes to buying a product. Product customization and personalization have become even more significant. With techniques like Market Basket Analysis, retailers can provide personalized recommendations to customers based on their purchase history and the buying behaviour of similar customers. By suggesting related or complementary products, businesses can enhance the customer experience, increase customer satisfaction, and drive additional sales.
- Optimizing Inventory Management
Understanding product associations helps businesses optimize inventory management. Businesses can ensure sufficient stock levels of related products by identifying frequently co-purchased items. This helps avoid stockouts, improves supply chain efficiency, and reduces holding costs for slow-moving items.
- Effective Pricing Strategies
Market Basket Analysis can inform businesses about price bundling opportunities. By identifying items that are frequently purchased together, businesses can create attractive bundle offers or pricing incentives to encourage customers to buy the bundled products. This strategy can increase sales and enhance customer perception of value.
- Targeted Marketing Campaigns
Insights derived from Market Basket Analysis enable businesses to design targeted marketing campaigns. Businesses can create customized promotions, coupons, or discounts tailored to specific customer segments by understanding which products are commonly bought together. This targeted approach enhances the effectiveness of marketing efforts and improves customer engagement.
- Improving Store Layout and Merchandising
With this technique, retailers can guide businesses in optimizing store layout and merchandising. Businesses can enhance customer convenience and encourage impulse purchases by placing frequently co-purchased items in close proximity. Strategic placement based on product associations can improve the overall shopping experience and drive sales.
- Data-Driven Decision Making
By leveraging Market Basket Analysis, businesses can make data-driven decisions backed by quantitative insights. Instead of relying solely on intuition or guesswork, businesses can base their strategies on actual purchase data and patterns. This enhances decision-making accuracy and increases the likelihood of achieving desired business outcomes.
Summary of Market Basket Analysis in Python:
Python provides various libraries, like mlxtend and sci-kit-learn, that offer implementations of Market Basket Analysis algorithms, simplifying the process and enhancing your analysis.
Note: This flowchart serves an overview of the steps involved in Market Basket Analysis in Python; each level has several sub-steps.
Wrapping it up !!!
Market Basket Analysis is a powerful technique that helps businesses uncover valuable insights from customer transaction data. As the competitive state landscape continues to increase, companies need to adopt newer technologies and tools that can help them assess consumer behaviour.