Logo:
Logo:  Areas Served:
 A Data Analysis Project — Coffee Shop Sales Analysis.
Last Updated on April 2, 2024 by Editorial Team
Author(s): Kamireddy Mahendra
Originally published on Towards AI.
The Objective of any data analyst is to find the hidden insights in the data and come out with useful suggestions or solutions to benefit the business.
Let’s dive into the world of data analysis.
Assuming that you are a data analyst, If not I will help you to become a data analyst by taking you through my experience in the field of data analysis.
Initially, I would like to suggest that, there is nothing right or wrong in data analysis. There is just efficient or inefficient data analysis only. How efficient your analysis helpful in helping business stakeholders gain their profits and solve their business problems is the end goal of any data analysis.
Are you ready?
Ok. Let’s take you through the process.
Initial steps to follow as a data analyst
— — — — — — — — — — — — — — — — — — — — — —
When any business Stakeholder comes to you and asks to help their business grow much better than the current status of the business, then you should follow these steps.
Ask Numerous Questions about the business and its problems.
Don’t hesitate to ask for clarification of your doubts if any are related to business and its problems.
Ask what all Expectations are from the data analysis. like to specify any specific suggestions for their business problems.
Ask and gather the data and have full clarity from the data by clarifying all doubts if any.
Steps Involved in the Data Analysis Process (General Steps to Follow as a Data Analyst)
- Gather the data in any spreadsheet or database and gain a basic understanding of the data that you have using any statistical techniques or by writing SQL Queries.
- Then, use any ETL tool to Extract, transform, and load into our desired workspace to analyze the data.
- We have many tools that offer features like ETL, Visualization, and validations.
- Consider any tool that makes your work easy and can able to give solutions in less time with more ease and optimization techniques.
- After importing the data clean the data as per the requirements and then load it into the workspace to visualize the data to showcase the insights in visual format with dashboards and reports.
- Come up with solutions to suggest to solve the business problems as requested by the stakeholders.
Here is the data analysis project (Assume this is a Mini Project) to make you familiar with the process of data analysis.
In this process, I am going to use Power BI and Excel. You can use any as you wish and resources/inputs given by the stakeholders.
One more thing here is you can act on both sides as a Stakeholder and data analyst. Assume you are running this Coffee Shop and then you need to enhance your business by solving all issues that occur.
Basic Insights that as a Business Stakeholder you can find from the data and expect any suggestions or solutions to increase business profits.
i. Number of Transactions that are happening for each month? and their total bill amount.
ii. Is there any pattern that transactions and total bills have if any? Does anything need to focus on changes or any observations?
iii. Which product has been selling more and which one is less? and what time, and purchase behavior of customers?
iv. What Sizes of each product have been selling more and less in what percentages?
v. On which day i.e. day name of the week has more sales and which one has less? any suggestions to improve for those on fewer sales days?
vi. Location in which one has highest and lowest on day name-wise.
vii. Location and month wise how purchase behavior of customers.
Let’s jump into data analysis with the help of visuals that I have created using Power BI.
i. What is the number of transactions that are happening each month? and their total bill amount.
- I hope you can easily understand by looking at the visual about how number of purchases and their bill amounts.
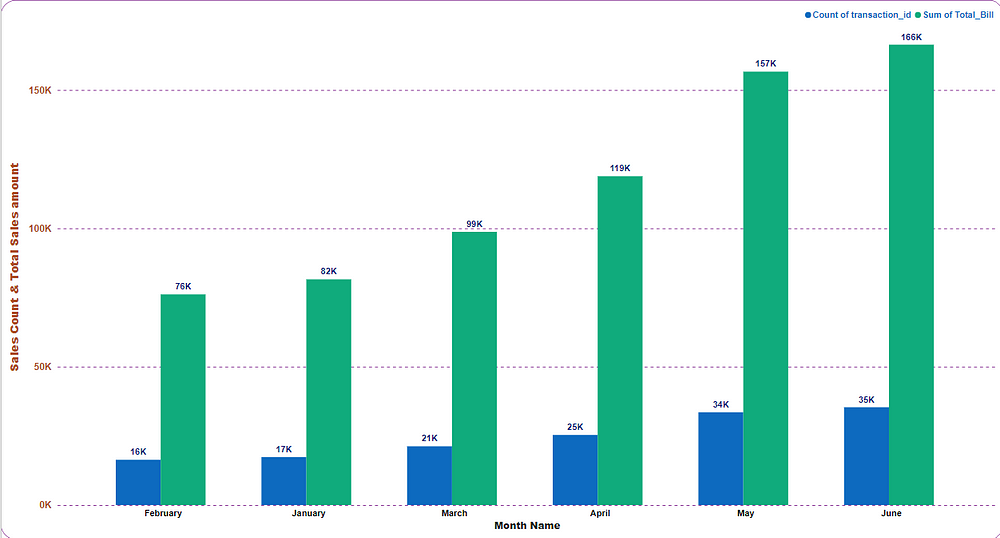
ii. Is there any pattern that transactions and total bills have if any? Does anything need to focus on changes or any observations?
- You can observe that there is no perfect linear relation between the various months. But there is number of purchases is increasing each month.
- Also, there is another observation that for every two months, the number of purchases has been increasing more than each month.
iii. Which product has been selling more and which one is less? and what time, and purchase behavior of customers?
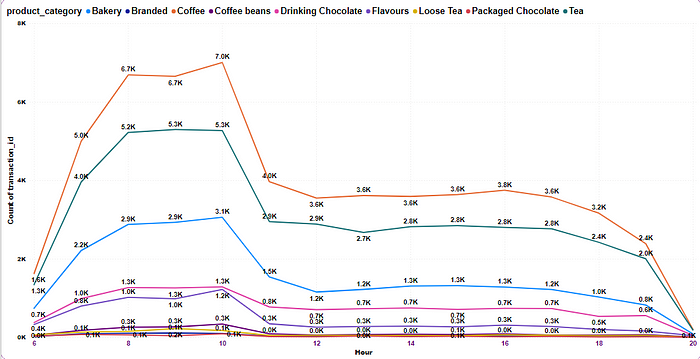
- You can easily observe with the help of a line graph and legend which product category has more purchases and which one has fewer.
- From the graph we can observe that coffee has a higher number of purchases and Packaged chocolate, Branded, and loose tea have little very low number of sales.
- These sales gradually increase from morning 6 am to 10 am and around 10 am the sales reach to maximum and then gradually decrease and fall to zero around 8 pm.
iv. What Sizes of each product have been selling more and less in what percentages?
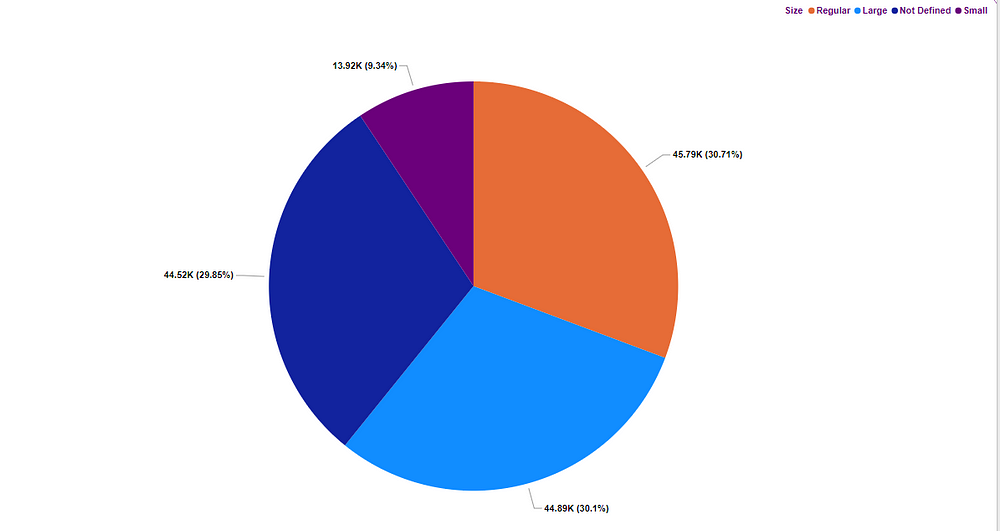
- The regular, Large, and undefined sizes have almost in same number of purchases, but regular has little more than the other two.
- The small size order has very less in number of sales and customers are not interested in small sized orders.
V. On which day i.e. day name of the week has more sales and which one has less? any suggestions to improve for those on fewer sales days?

- We can on Friday, the maximum number of purchases are happening and the lowest is on Saturday.
- We can increase sales on Saturday by providing offers on each purchase and giving some gift coupons or taking any external events to attract more customers on the weekend to increase sales.
Vi. Location in which one has the highest and lowest number of purchases on day name-wise.
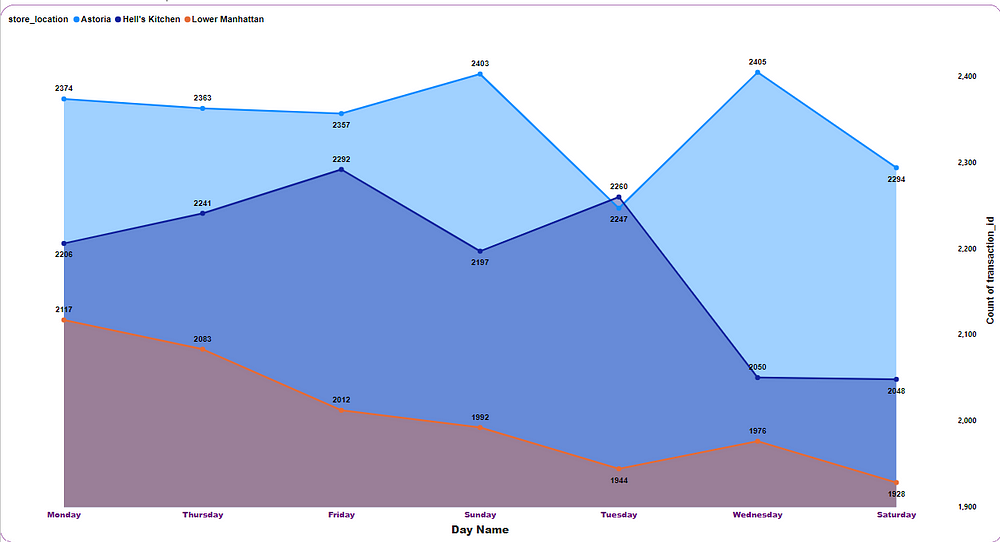
We can observe each location has its own high and low purchases. The Highest for Astoris on Wednesday and the lowest for Lower Manhattan on Saturday.
vii. Location and month wise how purchase behavior of customers.
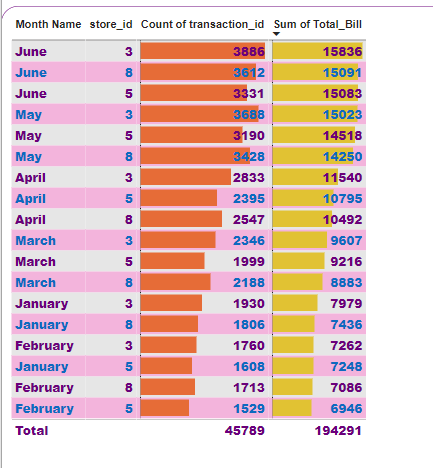
Sales are increasing month by month from January 2023 to June 2023. If we mention location wise then we can see store 3 has highest in June and followed by remaining. Similarly in February the lowest with store number 5 and followed by 8.
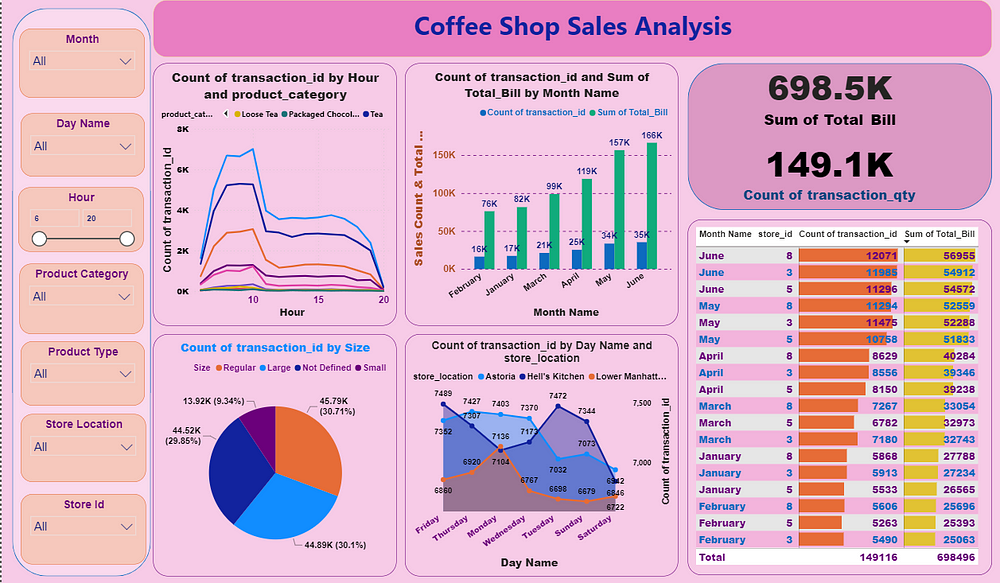
I hope you can understand by looking at the above dashboard like, how sales are and how customer behavior for each month and so on.
You can give suggestions to boost sales wherein low and add value to business by increasing the number of purchases with our suggestions. I strongly believe that this article is helpful for you. I hope you are with me throughout the entire data analysis process.
We have solved a few problems and extracted insights from the raw data. In real-world projects, there are many things that we are going to find using different statistics and many other techniques.
You can find all the project files in my GitHub data analysis repository.
Bring your hands together to create a resounding clap, fostering support and encouragement for me to share even more quality and valuable content in the future.
Learning “Web Scraping” Technologies Can Make Us a Millionaire!!
You can check a few other data analysis projects I have shared earlier, as shown below.
A Data Analysis Project- Data Science Job Postings. Power BI + SQL Server.
Follow me and subscribe to my newsletter to catch any updates from me.
Thank you 🙂
Smile ==> Adds Value to Our Life ==> Live fullest ==> Live Long!!
Join thousands of data leaders on the AI newsletter. Join over 80,000 subscribers and keep up to date with the latest developments in AI. From research to projects and ideas. If you are building an AI startup, an AI-related product, or a service, we invite you to consider becoming a sponsor.
Published via Towards AI
Related posts
Popular posts

 for 2021")


Updates

Recent Posts