article thumbnail

How to Create a Dot Plot in Python?

Analytics Vidhya

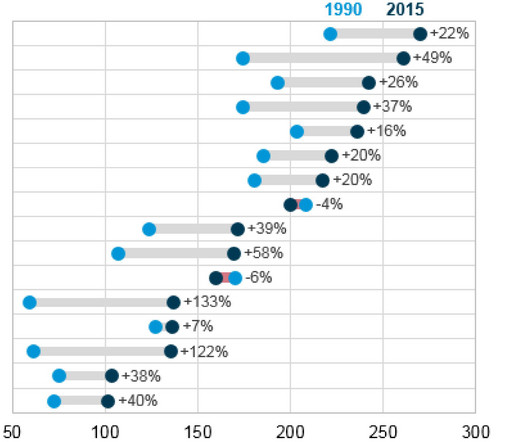
Introduction Data visualization is an essential aspect of data analysis, as it allows us to understand and interpret complex information more easily. One popular type of visualization is the dot plot, which effectively displays categorical data and numerical values.

Python 259
article thumbnail

Interactive Data Visualization using rbokeh

Analytics Vidhya

This article was published as a part of the Data Science Blogathon. Introduction Data Visualization is used to present the insights in a given dataset. With meaningful and eye-catching charts, it becomes easier to communicate data analysis findings.

professionals

Sign Up for our Newsletter

This site is protected by reCAPTCHA and the Google Privacy Policy and Terms of Service apply.

article thumbnail

Different Plots Used in Exploratory Data Analysis (EDA)

Heartbeat

Making visualizations is one of the finest ways for data scientists to explain data analysis to people outside the business. Exploratory data analysis can help you comprehend your data better, which can aid in future data preprocessing. Exploratory Data Analysis What is EDA?

article thumbnail

Standardize regression coefficients for models that include categorical variables

SAS Software

A previous article discusses standardized coefficients in linear regression models and shows how to compute standardized regression coefficients in SAS by using the STB option on the MODEL statement in PROC REG. The post Standardize regression coefficients for models that include categorical variables appeared first on SAS Blogs.

article thumbnail

Unleashing the Power of Applied Text Mining in Python: Revolutionize Your Data Analysis

Pickl AI

Since most of the data that companies have is unstructured and organized, text mining becomes a significant process. In this article, we will explore the concept of applied text mining in Python and how to do text mining in Python. Thus it helps in improving their products and services. What are the common applications of text mining?

article thumbnail

Microsoft Researchers Propose Neural Graphical Models (NGMs): A New Type of Probabilistic Graphical Models (PGM) that Learns to Represent the Probability Function Over the Domain Using a Deep Neural Network

Marktechpost

In the domain of reasoning under uncertainty, probabilistic graphical models (PGMs) have long been a prominent tool for data analysis. Many graphical models are designed to work exclusively with continuous or categorical variables, limiting their applicability to data that spans different types.

article thumbnail

Building an End-to-End Machine Learning Project to Reduce Delays in Aggressive Cancer Care.

Towards AI

This article seeks to also explain fundamental topics in data science such as EDA automation, pipelines, ROC-AUC curve (how results will be evaluated), and Principal Component Analysis in a simple way. Act One: Exploratory Data Analysis — Automation The nuisance of repetitive tasks is something we programmers know all too well.