Remove Business Intelligence Remove Categorization Remove Data Integration Remove Data Quality
article thumbnail

Top 50+ Data Analyst Interview Questions & Answers

Pickl AI

Data visualisation principles include clarity, accuracy, efficiency, consistency, and aesthetics. A bar chart represents categorical data with rectangular bars. In contrast, a histogram represents the distribution of numerical data by dividing it into intervals and displaying the frequency of each interval with bars.

article thumbnail

Everything You Need to know about Data Manipulation

Pickl AI

The data professionals deploy different techniques and operations to derive valuable information from the raw and unstructured data. The objective is to enhance the data quality and prepare the data sets for the analysis. What is Data Manipulation?

professionals

Sign Up for our Newsletter

This site is protected by reCAPTCHA and the Google Privacy Policy and Terms of Service apply.

article thumbnail

Principal Financial Group uses AWS Post Call Analytics solution to extract omnichannel customer insights

AWS Machine Learning Blog

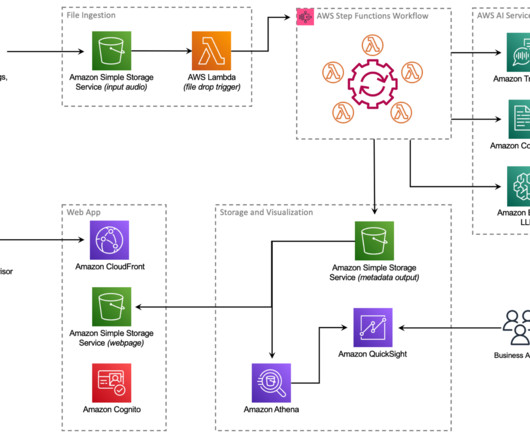
In this post, we demonstrate how data aggregated within the AWS CCI Post Call Analytics solution allowed Principal to gain visibility into their contact center interactions, better understand the customer journey, and improve the overall experience between contact channels while also maintaining data integrity and security.

article thumbnail

How to Build ETL Data Pipeline in ML

The MLOps Blog

Here are some specific reasons why they are important: Data Integration: Organizations can integrate data from various sources using ETL pipelines. This provides data scientists with a unified view of the data and helps them decide how the model should be trained, values for hyperparameters, etc.

ETL 59