Remove interactive-graphics
article thumbnail

ML Hyperparameter Optimization App using Streamlit

Analytics Vidhya

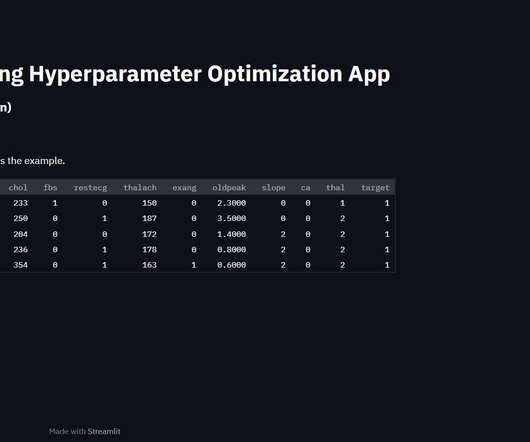
This article was published as a part of the Data Science Blogathon About Streamlit Streamlit is an open-source Python library that assists developers in creating interactive graphical user interfaces for their systems. Using Streamlit, we can quickly create interactive web apps and deploy them. Frontend […].

ML 346
article thumbnail

The metaverse isn’t dead (in fact its future in enterprise is promising)

Flipboard

We could walk around with wearables and interact in a realm overlaid with and enhanced by digital graphics, 3D and other interactive … At its outset, the metaverse offered an exciting new concept that had so far only existed in sci-fi: A virtual world where we could be anyone and anywhere we want.

professionals

Sign Up for our Newsletter

This site is protected by reCAPTCHA and the Google Privacy Policy and Terms of Service apply.

article thumbnail

UCSD Researchers Open-Source Graphologue: A Unique AI Technique That Transforms Large Language Models Such As GPT-4 Responses Into Interactive Diagrams In Real-Time

Marktechpost

It was discovered that verbose responses from LLM interfaces frequently made it difficult for users to immediately understand and interact with the information being displayed. This is done by instantly transforming the text-based responses produced by LLMs into graphical diagrams. Check out the Paper , Project , and Github.

article thumbnail

Create Interactive Dashboards with Streamlit and Python

Analytics Vidhya

Introduction In Data Visualization, Dashboard is the great Graphical User Interfaces that. The post Create Interactive Dashboards with Streamlit and Python appeared first on Analytics Vidhya. This article was published as a part of the Data Science Blogathon.

Python 288
article thumbnail

How to Package and Price Embedded Analytics

Just by embedding analytics, application owners can charge 24% more for their product. How much value could you add? This framework explains how application enhancements can extend your product offerings. Brought to you by Logi Analytics.

article thumbnail

Interactive Plots in Python with Plotly: A complete Guide

Analytics Vidhya

Data Visualization is the process of presenting data in pictorial and graphical format. The post Interactive Plots in Python with Plotly: A complete Guide appeared first on Analytics Vidhya. The visual representation of data makes understanding […].

Python 262
article thumbnail

10 Best AI Pitch Deck Builders

Unite.AI

With its advanced AI capabilities, Upmetrics offers a wealth of interactive templates, bringing a new level of engagement and clarity to your ideas. Storydoc Storydoc positions itself as a cutting-edge AI pitch deck generator, uniquely designed to produce highly engaging, interactive, and mobile-friendly presentations.

AI 290