

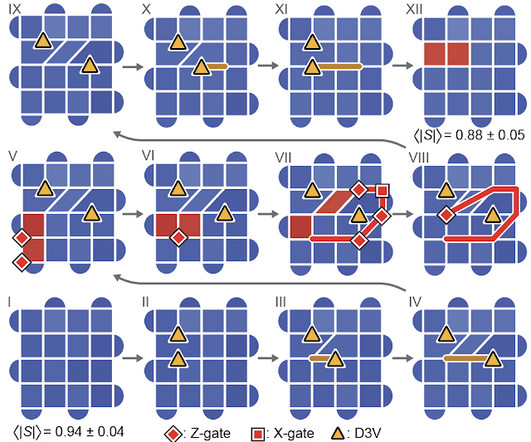
Pair Plots in Machine Learning
Analytics Vidhya
FEBRUARY 28, 2024
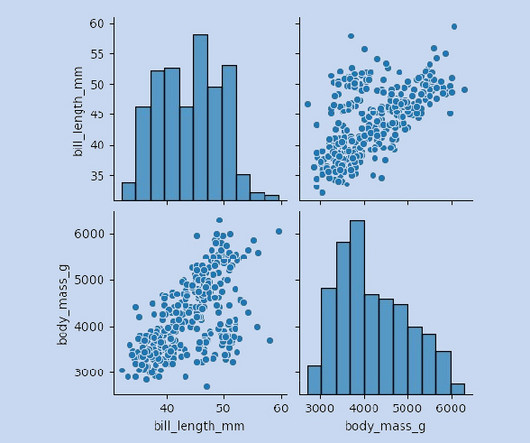
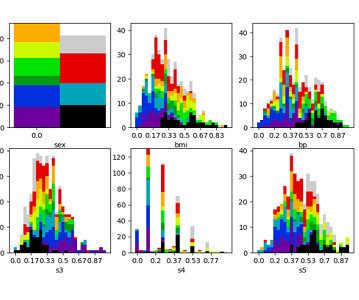
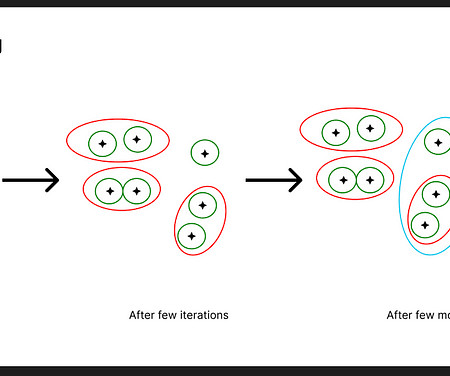
Among the myriad of tools available for EDA, pair plots stand out as a fundamental visualization technique that offers a multi-faceted […] The post Pair Plots in Machine Learning appeared first on Analytics Vidhya. This process is pivotal for recognizing patterns, identifying anomalies, and establishing hypotheses.


Let's personalize your content